


The real estate market cooled down a bit in 2018, with slightly fewer units sold and a bit more inventory on the market. Prices went up slightly, so in the end 2018 dollar volume was higher than 2017.
It’s still a seller’s market, but not quite as crazy as it was in 2017. If you’re patient you can find deals, but you need to be ready to snap them up when you do. If you’re selling there is more competition, so make sure your property stands out if you want to sell quickly.
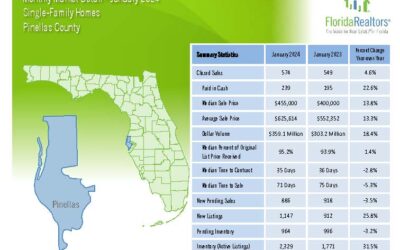
| Single Family Summary Statistics | 2018 | 2017 | Percent Change Year-over-Year |
| Closed Sales | 13,424 | 13,880 | -3.3% |
| Median Sale Price | $254,000 | $235,000 | 8.1% |
| Dollar Volume | $4.4 Billion | $4.2 Billion | 5.3% |
| Median Time to Sale | 66 Days | 70 Days | -5.7% |
| Inventory (Active Listings) | 3,319 | 2,890 | 14.8% |
| Months Supply of Inventory | 3.0 | 2.5 | 20.0% |
| Condos / Townhomes Summary Statistics | 2018 | 2017 | Percent Change Year-over-Year |
| Closed Sales | 9,055 | 9,013 | -0.5% |
| Median Sale Price | $165,000 | $153,500 | 7.5% |
| Dollar Volume | $2.2 Billion | $2.1 Billion | 6.8% |
| Median Time to Sale | 69 Days | 75 Days | -8.0% |
| Inventory (Active Listings) | 2,056 | 2,080 | 20.5% |
| Months Supply of Inventory | 3.3 | 2.7 | 22.2% |
0 Comments